Bitcoin spent eight straight months trading between roughly $15,500 and $25,000 in late 2022 and early 2023, a period so quiet and uneventful that most retail investors simply stopped paying attention entirely. That boring stretch, it turns out, was exactly the setup for the run that followed. Crypto markets move in repeating cycles, driven by the interaction of fear, greed, liquidity, and structural supply events like Bitcoin’s halving, and while no two cycles play out identically, the underlying four-phase pattern has stayed consistent enough to genuinely help investors set realistic expectations and avoid the same emotional traps that trip up nearly everyone at some point.
Why Crypto Markets Move in Cycles at All
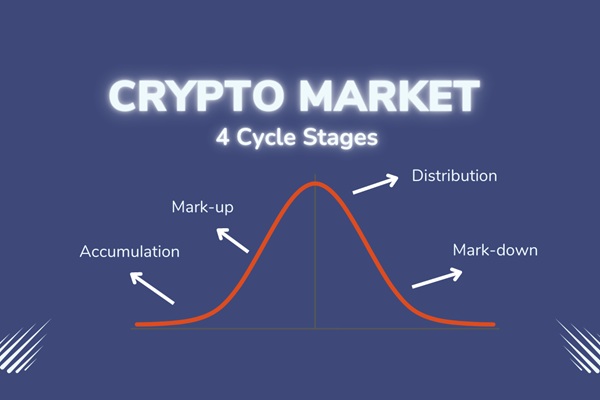
No asset class trends in one direction indefinitely, and crypto is no exception, prices move in cycles specifically because human behavior, the interplay of fear, greed, and available information, is itself cyclical.
- A crypto market cycle is the repeating pattern of price movement between an all-time low and the next all-time high, then back down again, driven by some combination of liquidity, supply dynamics, market sentiment, and broader macroeconomic policy.
- Bitcoin’s halving schedule has historically been the clearest structural driver of cycle timing, cutting new supply roughly every four years and, when demand holds steady or grows against that reduced supply, historically triggering the start of a bull phase.
- A complete cycle has historically spanned approximately four years, though the exact duration of each individual phase varies considerably, the 2022 bear market lasted roughly a year, while the 2020-2021 bull run extended for nearly two.
Phase 1: Accumulation — The Quiet Bottom
This phase comes immediately after a major crash, and it’s deliberately unglamorous, which is exactly why most people miss it entirely.
- Prices are low, news coverage is overwhelmingly negative, and most retail investors have lost interest or given up on the asset class entirely.
- This was genuinely the case after the 2018 bear market, and again following the FTX collapse in 2022, both periods where public sentiment had turned sharply against crypto.
- “Smart money,” institutional investors and experienced long-term holders, quietly begins buying while the broader public stays away, accumulating positions at meaningfully discounted prices.
- Accumulation genuinely feels boring, and that’s the point, in 2019 Bitcoin spent months trading far below its previous 2017 peak while most people simply ignored it, that quiet, unremarkable stretch came directly before the next strong run.
- The classic behavioral trap here: convincing yourself nothing will ever recover, precisely the moment when sentiment is most negative and opportunity is often greatest.
Phase 2: Markup — The Bull Run
This is when prices start rising steadily, confidence genuinely returns, and fresh capital begins flowing back into the market.
- More investors notice as prices climb, media coverage explodes, and millions of new participants enter the market chasing the visible momentum.
- During the 2020-2021 bull run, Bitcoin climbed from under $10,000 to nearly $69,000, a trajectory that drew in an enormous wave of first-time crypto buyers.
- Headlines turn loud during this phase: prices rise faster, search interest climbs sharply, and influencers begin posting increasingly bold price targets.
- The classic behavioral trap here: believing every dip during this phase is “the last cheap entry,” a mindset that can lead to chasing increasingly overextended prices as the rally matures.
Phase 3: Distribution — The Sideways Top
Distribution happens near the cycle’s peak, and it’s genuinely one of the harder phases to recognize in real time, since the market can still look outwardly strong even as the underlying dynamics shift.
- Early investors, those who accumulated during the quiet bottom, begin taking profits, while newer investors, drawn in by the markup phase’s momentum, continue buying at elevated prices.
- The market can trade sideways for an extended period, giving the impression of continued strength even as large holders are quietly reducing their positions.
- The classic behavioral trap here: assuming prices can only continue going higher, precisely because the market still feels euphoric even as the actual structural momentum has begun to fade.
Phase 4: Markdown — The Bear Market
This is the phase most people remember most vividly, and understandably so, given how sharply sentiment and prices both turn.
- Selling pressure overwhelms buying interest, and prices drop sharply as fear and panic spread through the market.
- Leverage gets liquidated, forced selling from over-levered traders and funds, and retail investors frequently sell at a genuine loss during this phase, often near the actual bottom rather than before it.
- Bear markets have historically featured 70-85% drawdowns from the previous peak, a genuinely severe decline that tests conviction even among experienced holders.
- The classic behavioral trap here: selling out of fear after having already absorbed heavy losses, precisely the point where the cycle is often closest to resetting into a fresh accumulation phase.
- This phase continues until capitulation occurs, the point of maximum pessimism, which then sets the stage for the next accumulation phase to quietly begin all over again.
Why the 2024-2026 Cycle Has Behaved Differently
It’s genuinely important not to treat past cycles as a script rather than a rough guide, since structural changes to the market have meaningfully altered how this cycle has actually unfolded.
- S. spot Bitcoin ETFs have pulled in roughly $87 billion in inflows since launch, giving institutional capital a direct, regulated entry point that simply didn’t exist during earlier cycles.
- The October 2025 price peak landed close to where historical models predicted, but the subsequent drawdown was only around -36%, notably milder than the -70% to -85% textbook bear market decline seen in previous cycles.
- Growing institutional participation and mature ETF infrastructure are leading some analysts to believe future cycles may stretch longer, or compress differently, than the historical four-year pattern, as extreme retail-driven volatility gets increasingly offset by steadier institutional flows.
- Each cycle genuinely has unique characteristics: the ICO-driven 2017 cycle, the DeFi-driven 2021 cycle, and the ETF-driven 2024-2026 cycle all behaved differently from one another, historical patterns are a guide, not a fixed script to trade against.
On-Chain Indicators Traders Use to Gauge Where the Market Stands
Beyond price charts alone, several data-driven tools help investors estimate which phase of the cycle the market is currently in.
- MVRV Z-Score compares an asset’s market value to its “realized value” (the aggregate cost basis of all coins), helping flag when an asset is statistically overvalued or undervalued relative to historical norms.
- Exchange inflows and outflows reveal whether large holders are moving coins onto exchanges (often a precursor to selling) or withdrawing them into cold storage (often a signal of longer-term holding intent).
- The Fear and Greed Index aggregates sentiment data into a single score, useful for gauging whether the broader market mood has become extreme in either direction.
- None of these indicators works as a standalone signal, each functions as one input among several, and no framework fully eliminates timing risk, which is exactly why position sizing and disciplined risk management matter more than trying to call the precise top or bottom.
How Experienced Investors Adjust Strategy Across the Cycle
Rather than trying to time exact entries and exits, many disciplined investors adapt their overall approach to whichever phase the market appears to be in.
- Aggressive dollar-cost averaging (DCA) during accumulation, buying steadily while sentiment is weak and prices remain depressed.
- Gradual, staged profit-taking during the bull run, rather than trying to sell everything at the exact top, which is genuinely impossible to time consistently even for professionals.
- Capital preservation and reduced risk exposure during distribution and the bear market, some investors specifically maintain a portfolio split, for example 60% in large-cap assets, 20% in cash or stablecoins, and 20% in higher-risk positions, adjusting that balance as the cycle progresses.
- Thinking in layers rather than all-in bets is the consistent theme across disciplined approaches, since psychology, not just bad asset selection, is what causes most investors to lose money through poor timing, panic selling, and overconfidence near the top.
The Bottom Line
Cryptocurrency markets move through four repeating phases, accumulation, markup, distribution, and markdown, driven by the same underlying combination of liquidity, supply dynamics, and human psychology every cycle, even though the specific catalysts and exact timing differ each time around. Recognizing which phase the market is likely in, quiet and unloved versus loudly euphoric, helps investors avoid the classic behavioral traps that repeat every cycle: giving up during accumulation, chasing every dip during markup, assuming prices can only rise during distribution, and panic-selling during markdown. This is general educational information, not financial advice; cryptocurrency remains highly speculative and volatile, past cycles are never a guarantee of future performance, and any investment decisions should be made only with capital you can genuinely afford to lose, ideally after consulting a qualified financial adviser.
Frequently Asked Questions
Q1. How can I tell which phase of the market cycle we’re currently in?
A: No single indicator gives a definitive answer, but combining on-chain data like the MVRV Z-Score, exchange inflow/outflow trends, and sentiment tools like the Fear and Greed Index, alongside price action itself, gives a reasonable composite picture, though phase boundaries are genuinely much easier to identify in hindsight on a chart than while you’re actually living through them.
Q2. Is it still safe to assume Bitcoin’s four-year halving cycle will keep driving predictable bull and bear markets?
A: Not with the same certainty as before, the 2024-2026 cycle has already behaved differently from historical patterns, with a milder drawdown than the textbook -70% to -85% bear market decline, largely because institutional ETF inflows have changed market structure in ways that didn’t exist during earlier cycles, so treat the halving theory as a useful guide rather than a guaranteed script.
Q3. What’s the biggest mistake investors make during the accumulation phase specifically?
A: Giving up entirely, since accumulation phases are deliberately quiet and unremarkable, often lasting many months with flat prices and overwhelmingly negative sentiment, exactly the environment where most retail investors lose interest right before the next meaningful upward move historically began.
Q4. Should I try to sell everything exactly at the market top during the distribution phase?
A: Most experienced investors avoid trying to time an exact top, since distribution phases often still feel strong and euphoric even as underlying momentum is fading, making gradual, staged profit-taking a more realistic and disciplined approach than attempting to call the single best exit moment.